Ticket #984 (closed assessed: not an issue)
Ecosim screen vs results mismatch
| Reported by: | cathyb | Owned by: | |
|---|---|---|---|
| Priority: | normal | Milestone: | Ecopath 6: release 6.2 |
| Component: | Ecosim | Version: | |
| Severity: | tweak | Keywords: | |
| Cc: |
Description (last modified by jeroens) (diff)
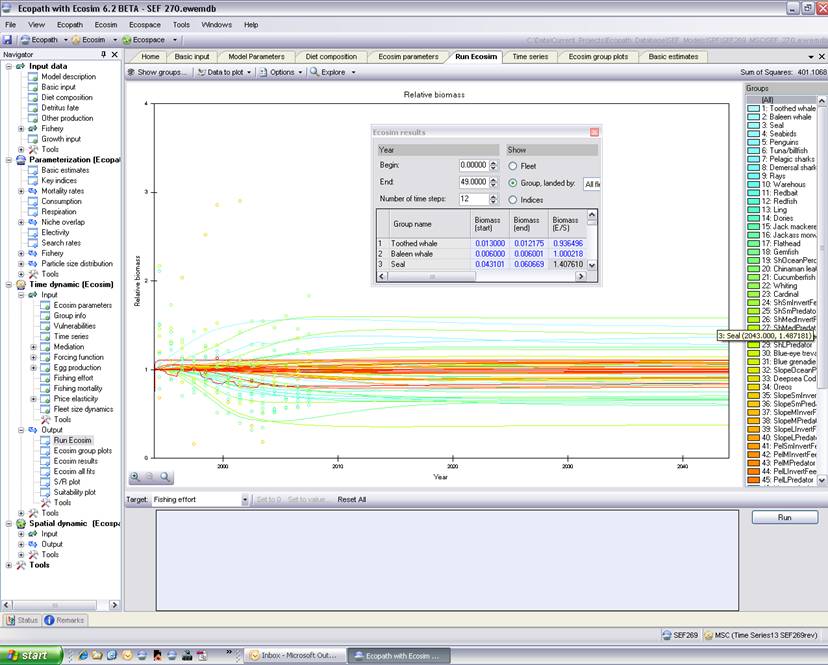
Here is example of that bug; the first image shows really minor differences: the Seal group relative change in the Results tab shows 1.407610 (presumably end of year 49) while the Ecosim plot tag shows 1.487181 at 2043.
The Basic Estimates tab (which you don’t have a shot of ) show seal starting biomass as 0.0408 and the Ecosim Results tab shows it as 0.043101 (but ok difference if Ecosim start one month after zero).
If you divide the end biomass i.e. 0.060669 by the Basic estimates zero starting mass you get 1.486985 (closer to the screen tag 1.487181 than to the Results E/S of 1.407610).
Ok these are really tiny but it would be good to know exactly at what point these values are taken for these calculations and make sure they are consistent. (Perhaps I need to read the manual J).
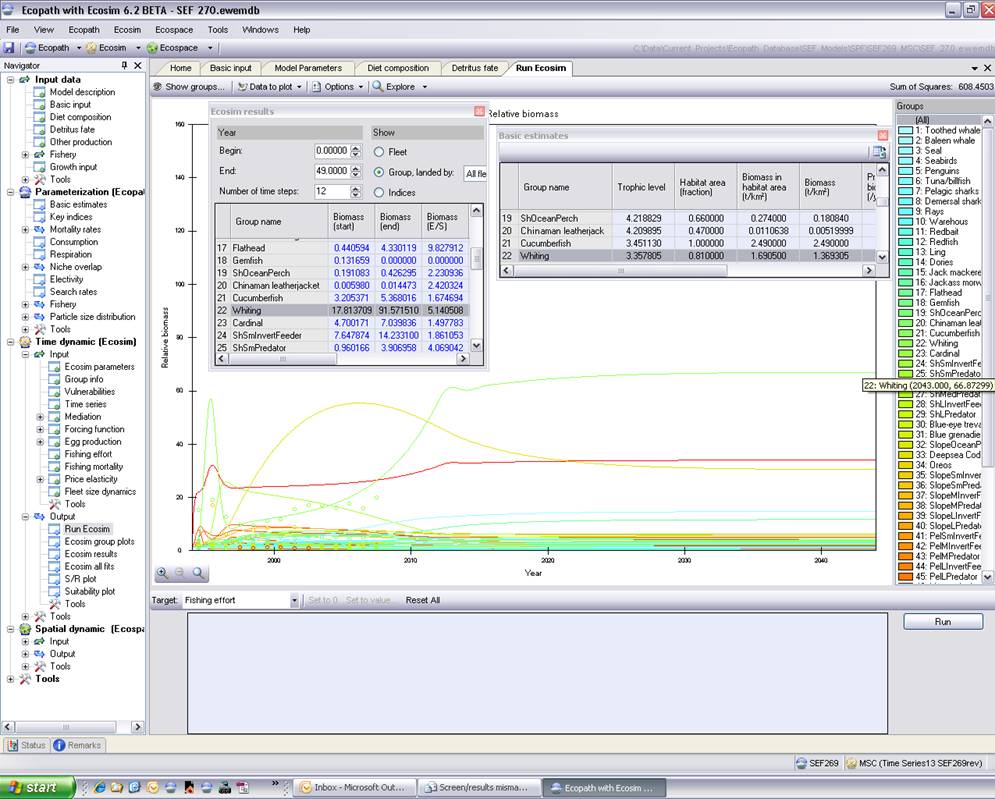
But here, image 2, is an example of things going haywire where those differences are much larger and potentially misleading.
Whiting on the Ecosim screen tag and the screen plot itself apparently increases x66.87299 but the Ecosim Results s/s says only 5.140508. Here you can see a really big difference in the starting biomass of the Ecosim Results tab 17.813709 cf the basic estimates tab 1.369305.
This would cause me grief if, as I usually do, cut and paste the Ecosim results without checking absolutely although I know if they are really off as these are. But then I try not to get haywire results such as theseJ. But you can see what I mean about mismatches now. I hope J.
My take on this would be that your starting point is your starting point i.e. before you start cranking anything and pretty much as the screen display shows.
An issue of which value to use I think and maybe this has always been the case and that my models are so well-behaved that I haven’t noticed the difference before. Huh if only.
Attachments
Change History
Changed 14 years ago by jeroens
- Attachment image003.jpg added
comment:2 Changed 14 years ago by joeb
- Status changed from new to closed
- Resolution set to not an issue
The values in 'Ecosim results' tab are the average over the period defined in the 'Number of time steps' at the top of the form. The default for this is ‘Begin’ = zero and ‘Number of time steps’ = twelve, so the Biomass (start) is the average of the first twelve time steps computed by Ecosim. This does not include Ecopath baseline value, it starts at the first time step computed by Ecosim.
It is a little hard to tell from image 2 but the biomass appears to change rapidly when the model first starts and the Ecosim results biomass is the average over the first year. This number will not be the same as the Ecopath start value from basic estimates. All E/S values are calculated from the average values for the defined Begin and End periods.
Minor differences