Ticket #644 (closed assessed: not an issue)
Relative biomass Timeseries not plotting properly
| Reported by: | shermanl | Owned by: | joeb |
|---|---|---|---|
| Priority: | normal | Milestone: | Ecopath 6: release 6.0.8 |
| Component: | Ecosim | Version: | |
| Severity: | minor | Keywords: | |
| Cc: |
Description (last modified by shermanl) (diff)
When a TimeSeries? is set to relative (starting point at 1), it scales the Ecosim output plot for that group.
Reported by Cathy Bulman. See two attachments below.
From: <Cathy.Bulman@…>
To: <drmbongo@…>
Hi Jeroen
I still can’t quite get whether this is a display problem or my non-understanding of how these time series (i.e. type relative Biomass) are rescaled>
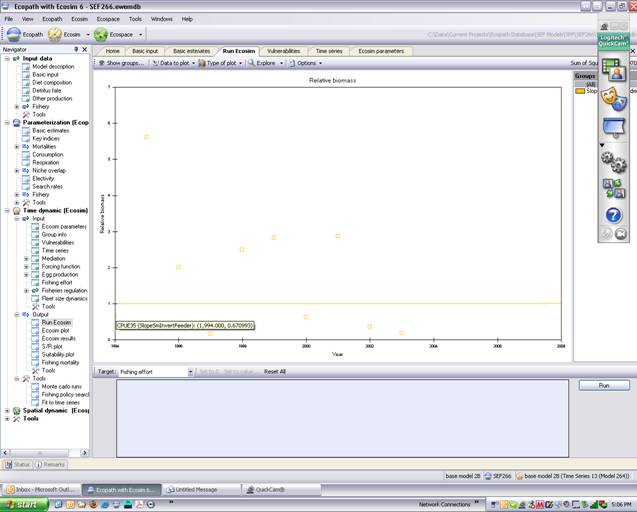
EG. If you can see this plot for CPUE 35 first value for 1994 is 1. It is even plotted on the time series as 1. All my time series start at 1 so I didn’t think rescaling of any sort was necessary (Beth doesn’t believe so either)
But take a look at the Ecosim plot. The cursor is where the first of the time series 35 is plotted (i.e. at 0.67). Sorry yellow isn’t a good display colour!
So, if I’ve completely missed something here, could someone please explain the format for the rescaling.
Attachments
Change History
comment:3 Changed 15 years ago by jeroens
- Component changed from Contaminant tracing to Ecosim
- Severity changed from block to minor
comment:5 Changed 15 years ago by shermanl
- Milestone changed from Ecopath 6: build 6.0.7 to Ecopath 6: build 6.0.8
comment:8 Changed 15 years ago by joeb
Relative Biomass timeseries values are scaled by mle (mean log error) and then made relative to the start biomass value (biomass from Ecopath) display value = obs(t)/exp(mle)/B0. This is the value that you see when you hover the cursor over a timeseries data point. Not the value in the data point. Would it be better to hide this value?