| Version 4 (modified by shermanl, 13 years ago) (diff) |
|---|
8.9 Forcing function
As presently conceived Ecosim does not incorporate the interactions between the components of the food web defined by the underlying Ecopath file, and physical or other environmental factors affecting the ecosystem thus described. Ecosim, like Ecopath, describes only feeding interactions. Ecosim does, however, contain a routine to allow a 'forcing function', which may represent physical or other environmental parameters, to influence these trophic interactions. These forcing functions, which can be used to modify the Q/B ratio of the consumer groups included in an underlying Ecopath file (see Linking mediation and time forcing functions to trophic interaction rates). You can also use a forcing function to force primary production directly (see Primary production in Ecosim). Forcing functions in Ecosim are of two types:
- Seasonal (i.e. cycles within a year that repeat annually); and
- Long-term (monthly).
Each seasonal shape may be different. It might be appropriate to use highly variable shapes for 'fast groups' (usually small organisms) and shapes with low amplitude for slow groups (usually large, long-lived organisms).
The long-term shapes are similar to the seasonal shapes, except that their time scales refer, as the name implies, to a period of years equal to the duration of the simulation (calculated with monthly time steps). If your time series has annual time steps, Ecosim will use the same value for each month in the year. Such shapes may be used to represent e.g., decadal regime shifts, such as occur in the North Pacific.
Defining Seasonal / Long-term forcing shapes
Important note: after you have defined forcing shape(s) as described below, you must continue to one of the Apply forcing function forms (Apply FF (consumer) or Apply FF (primary producer)) to set the groups affected by the forcing function.
There are a number of ways to define forcing shapes in Ecosim. First, forcing functions can be read in as time series from a csv file using the Import time series on the Time series form or the Ecosim menu. Set the 'data type' to 2 in the csv file. Note the series must be activated using the Apply time series dialogue box, accessible from the Ecosim menu or the Time series form.
Alternatively, you can define a forcing function using the Forcing function form (Time dynamic (Ecosim) > Input > Forcing function). Note you must have an Ecosim scenario loaded before you can open this form.
When you open the Forcing function form for the first time, you will see four 'blank' forcing shapes (three seasonal shapes and one annual forcing shape), each with constant default value of 1.0. If there is currently a data file activated containing one or more time series of data type 2, these will also be displayed.
To define a forcing shape using the Forcing function form, first select one of the 'blank' shapes in the lower pane. Be sure to select a 'Seasonal shape' for monthly data or a 'Forcing shape' for long-term data. You can then define forcing shapes in one of two ways:
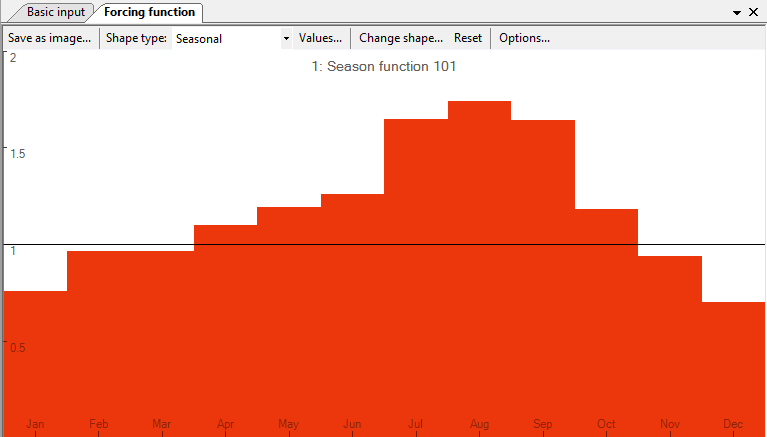
- Shapes can be drawn freehand using the red sketch pad. If you have selected a Seasonal shape, the x-axis will appear as the months January to December and your sketch will be drawn in monthly blocks (Figure 8.15a). If you have selected an annual Forcing shape, the x-axis will be shown as Years 1-100. The sketch will be smooth (Figure 8.15b). You will see your sketched shape transferred to the selected shape in the bottom pane;
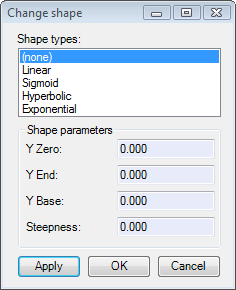
- Alternatively, you can use standard mathematical shapes. Click Change shape… at the top of the form to open the Change shape dialogue box. Select a shape type (e.g., linear, sigmoid, exponential) from the menu in the window. You can tailor the shape to your specific requirements by setting the Y Zero, Y End, Y Base and Steepness parameters (where appropriate) in the cells provided.
Save as image …
Clicking the Save as image … button at the top of the form opens a dialogue box prompting you to save the current trophic mediation shape to a bitmap file (.bmp). Use this dialogue box to name the file and browse for a location to save it.
Shape type
Select whether the selected shape is a seasonal or long-term forcing shape.
Values ...
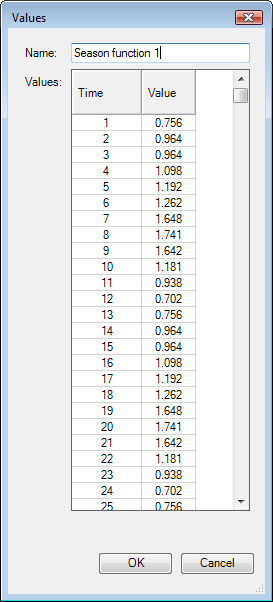
Displays the values of the current forcing shape.
Change shape ...
See point 2 above.
Reset
Resets the current forcing or seasonal shape to the default constant value of 1.0.
Options ...
Opens the Graph display options dialogue box. Set the way the forcing shape is displayed in the main window of the Forcing function form.
There are four additional menu items on the bottom pane of the Forcing function form that allow you add, copy, rename and delete forcing or seasonal shapes.
Add…
Adds an extra blank long-term forcing shape. If necessary, use Shape type to change the long-term forcing shape to a seasonal shape.
Duplicate
Copies the currently-selected shape.
Remove...
Removes the currently-selected shape. A warning that shape-deletion cannot be undone will appear. Click Yes to remove the shape.
Rename...
Rename the currently-selected shape by selecting Rename. You will then be able to type in a new name for the shape.
Figure 8.15 Examples of a) a seasonal forcing function and b) a long-term (annual) forcing function.
Figure 8.16 The Change shape dialogue box.
Figure 8.17 The Values dialogue box.


