Ticket #644 (new) — at Initial Version
Relative biomass Timeseries not plotting properly
| Reported by: | shermanl | Owned by: | joeb |
|---|---|---|---|
| Priority: | normal | Milestone: | Ecopath 6: release 6.0.8 |
| Component: | Ecosim | Version: | |
| Severity: | minor | Keywords: | |
| Cc: |
Description
When a TimeSeries? is set to relative (starting point at 1), it scales the Ecosim output plot for that group.
Reported by Cathy Bulman.
From: <Cathy.Bulman@…>
To: <drmbongo@…>
Hi Jeroen
I still can’t quite get whether this is a display problem or my non-understanding of how these time series (i.e. type relative Biomass) are rescaled>
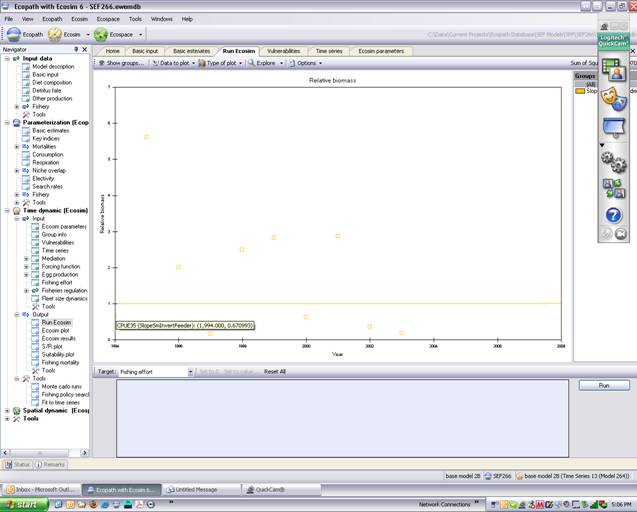
EG. If you can see this plot for CPUE 35 first value for 1994 is 1. It is even plotted on the time series as 1. All my time series start at 1 so I didn’t think rescaling of any sort was necessary (Beth doesn’t believe so either)
But take a look at the Ecosim plot. The cursor is where the first of the time series 35 is plotted (i.e. at 0.67). Sorry yellow isn’t a good display colour!
So, if I’ve completely missed something here, could someone please explain the format for the rescaling.